

Every year, Pennsylvania’s roads generate an enormous amount of data — and behind every number is a real person and a real family. Understanding these statistics does more than satisfy curiosity: it shows when, where, and why crashes happen, which helps drivers stay safer and helps crash victims understand the landscape they are suddenly navigating. This page pulls together the most recent Pennsylvania crash data, the odds of being involved, the deadliest roads and highest-risk counties, and what all of it means if you have been hurt.
The figures here come from the Pennsylvania Department of Transportation’s (PennDOT) 2025 Crash Facts & Statistics — the most recent complete year of statewide data — along with PennDOT’s official county-level crash records. And 2025 brought genuinely historic news: the fewest traffic deaths ever recorded in Pennsylvania. At GLS Injury Law, we handle car accident cases across Lancaster, York, and Chester County, and we have recovered more than $120,000,000 for injured clients. Here is what the numbers say.
Pennsylvania Crashes at a Glance (2025)
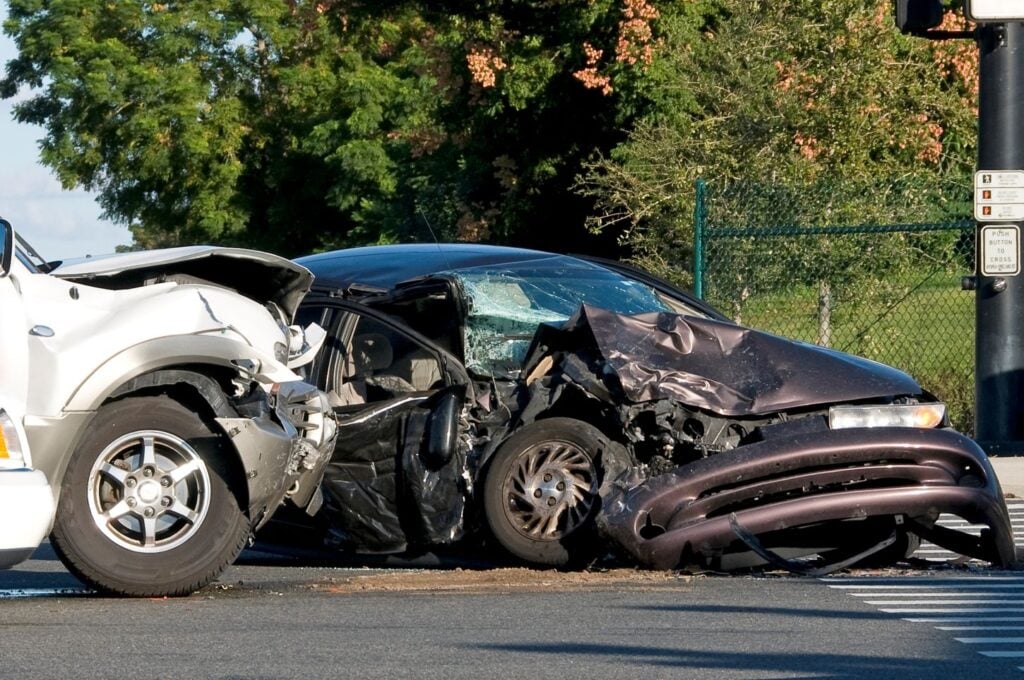
In 2025, Pennsylvania recorded 109,541 reportable traffic crashes. Those crashes killed 1,047 people and injured another 64,988. The death toll is the headline: it is the lowest number of traffic fatalities in Pennsylvania since record-keeping began in 1928. Compared with 2024, total crashes fell by 1,224, fatalities fell by 80, and injuries dropped by nearly 2,000.
| 2025 Pennsylvania Crash Data | Figure |
| Reportable traffic crashes | 109,541 |
| People killed | 1,047 (lowest on record) |
| People injured | 64,988 |
| Suspected serious injuries | 4,632 |
| Crashes per day (average) | About 300 (roughly 13 per hour) |
| Deaths per day (average) | About 3 (roughly one every 8 hours) |
| People injured per day (average) | About 178 (roughly 7 per hour) |
| Fatality rate (per 100M vehicle-miles) | 1.10 — below the projected U.S. rate of 1.20 |
That fatality figure caps a steady multi-year decline. Pennsylvania traffic deaths peaked recently at 1,230 in 2021, then fell to 1,179 in 2022, 1,209 in 2023, 1,127 in 2024, and 1,047 in 2025 — each of the last two years setting a new modern low. It is real, measurable progress, even as the numbers remain far too high.
What Are the Odds of Being in a Crash — or Dying — in Pennsylvania?
People often search for the “odds of dying in a car crash.” PennDOT actually calculates this directly. Based on Pennsylvania’s 2025 population of about 13.1 million, the official figures for the year were:
- 1 in 55 people was involved in a reportable traffic crash.
- 1 in 201 people was injured in a reportable traffic crash.
- 1 in 12,473 people was fatally injured in a reportable traffic crash.
Those are among the more encouraging odds Pennsylvania has posted in years — but they are not fixed. The single biggest variable is driver behavior, which PennDOT identifies as the leading factor in roughly 83% of all crashes. The choices behind the wheel — not bad luck — drive most of the risk, which means most of these crashes were preventable.
Why Crashes Happen: The Leading Causes (2025)
PennDOT’s 2025 data points to a familiar set of behaviors and conditions behind Pennsylvania’s crashes:
- The most common crash setting by far — 41,110 crashes in 2025 occurred at intersections, where failure to yield, red-light running, and misjudged turns collide.
- Speed was a factor in 24,166 crashes in 2025 — one of the largest single categories, and a major driver of fatal crashes because higher speeds cut reaction time and multiply impact forces.
- Distracted driving. 9,419 crashes in 2025 involved a distracted driver — a persistent and likely under-reported cause, and the very danger behind Pennsylvania’s Paul Miller’s Law.
- Impaired driving. 8,658 crashes in 2025 involved an impaired driver. Encouragingly, alcohol-related crashes and deaths both fell to their lowest totals in five years.
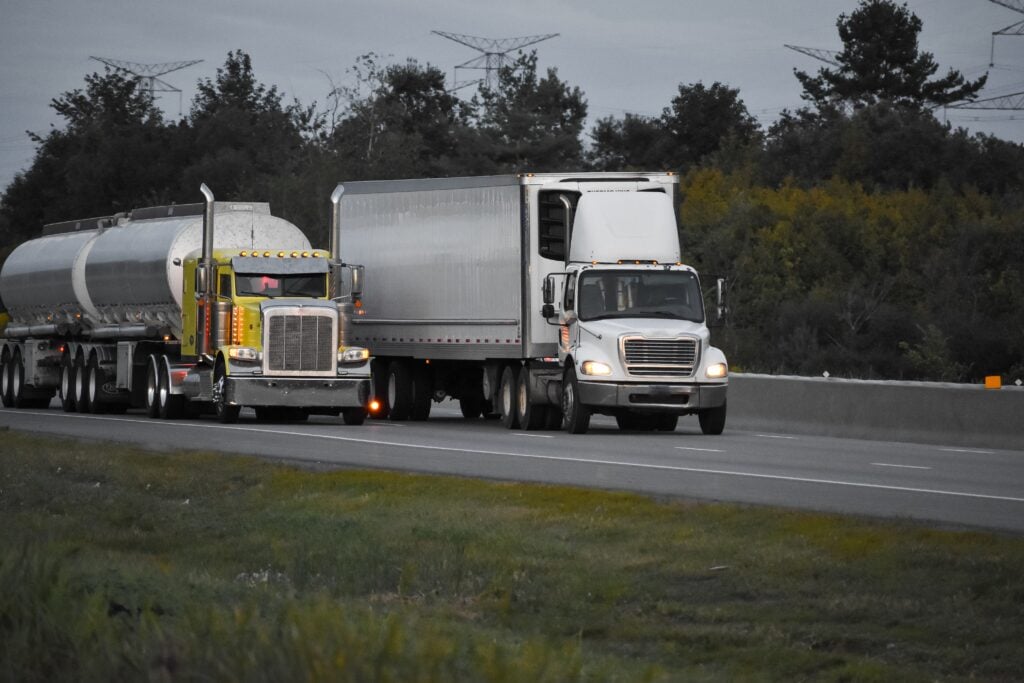
- Heavy trucks. 7,094 crashes in 2025 involved a heavy truck — collisions that, because of the size disparity, cause a disproportionate share of catastrophic injuries.
- Unbelted occupants. Seat belts remain the difference between life and death: 42% of all the people who died in Pennsylvania crashes in 2025 were not wearing one.
The Deadliest Roads in Pennsylvania
Not all roads carry equal risk, and the pattern is often the opposite of what people expect. Two truths stand out in the data:
- Crashes concentrate in a handful of counties. PennDOT’s 2025 maps show that just 10 of Pennsylvania’s 67 counties accounted for about 53% of all crashes, and 10 counties for about 44% of all fatalities. High-volume metro areas — led by Philadelphia and Allegheny County (Pittsburgh) — top the raw counts. Philadelphia’s Roosevelt Boulevard (US-1) is repeatedly cited among the most dangerous roads in the entire country, owing to its wide multi-lane design, high speeds, and heavy pedestrian traffic.
- Rural roads are disproportionately deadly. Two-lane rural roads produce a share of fatal crashes far larger than their share of total crashes. Higher speeds, no median barrier, undivided oncoming traffic, and longer emergency response times make a rural crash more likely to be fatal, even though cities see more crashes overall.
In short: you are more likely to be in a crash in the city, but a crash on a rural highway is more likely to be deadly. Interstates and busy US routes carry large crash volumes as well, given the speeds and traffic they handle.
Local Focus: Lancaster, York & Chester Counties (2025)
For south-central Pennsylvania — the heart of GLS Injury Law’s service area — crash risk is a daily reality on busy corridors like Route 30, Route 222, and Route 283. All three counties rank among the higher-volume counties in the state; Lancaster in particular falls into PennDOT’s highest crash-count category. Here is how the three counties compared in 2025:
| County (2025) | Total Crashes | Serious Injuries | Traffic Deaths |
| Lancaster | 5,675 | 235 | 38 |
| York | 4,423 | 214 | 26 |
| Chester | 4,381 | 131 | 35 |
The year-over-year story is where it gets interesting — and it does not simply track the statewide decline. Lancaster County, the busiest of the three, saw its traffic deaths fall sharply from 52 in 2024 to 38 in 2025. York County improved even more dramatically, dropping from 41 deaths to 26, though its serious injuries rose (from 186 to 214). Chester County, however, bucked the statewide trend entirely: its traffic deaths rose from 24 in 2024 to 35 in 2025, an increase driven substantially by a jump in motorcyclist fatalities, which nearly doubled from 6 to 11. It is a county-level reminder that a good statewide year does not mean every community got safer.
PennDOT’s data even pinpoints where crashes concentrate locally. In an analysis of crashes from 2020 through 2024, the intersection of Prospect Road and Fairview Road in West Hempfield Township had the highest crash rate of any intersection in Lancaster County, and the intersection of Lincoln Highway and Octorara Trail in Sadsbury Township recorded 52 crashes over that period. Knowing your local danger spots is one small way the data can keep you safer.
Who Is Most at Risk
The data also highlights which road users bear an outsized share of the harm:
- Unbelted occupants. 42% of people killed in 2025 crashes were not wearing a seat belt — the simplest, most effective way to survive a crash, and one too many people still skip.
- With little protection, riders account for a share of deaths far larger than their share of vehicles. In 2025 there were 2,941 motorcyclist crashes statewide — and locally, a rise in motorcyclist deaths drove Chester County’s fatality increase.
- People on foot were involved in 2,867 crashes statewide in 2025, and pedestrian fatalities remain heavily concentrated — PennDOT found that just seven counties accounted for about 59% of them.
The pedestrian numbers are a reminder that people on foot face unique dangers and unique legal protections; if you were hurt walking, our guide to pedestrian accident rights explains how Pennsylvania law works in your favor.
There Is Real Good News in These Numbers
It is worth pausing on the encouraging trend. Pennsylvania’s 2025 fatality rate — 1.10 deaths per 100 million vehicle miles traveled — fell from the prior year and came in below the projected national rate of 1.20, continuing a pattern in which Pennsylvania’s rate has run below the U.S. average for most years since the late 1930s. Alcohol-related crashes and deaths hit their lowest totals in five years. Sustained investment in safer roads (rumble strips, cable median barriers, high-friction surfaces, and pedestrian countdown timers at hundreds of intersections) and behavioral enforcement appears to be paying off. The roads are still far too dangerous — but the direction is unmistakably positive.
What These Statistics Mean If You’ve Been in a Crash
Statistics describe the pattern; they do not decide your case. What matters for an injured person is proving what happened in their specific crash and recovering fully for it. The same causes that dominate the data — speeding, distraction, impairment, failure to yield at intersections — are exactly the forms of negligence that establish another driver’s fault. If a distracted driving or impaired driver caused your crash, that conduct is powerful evidence supporting your claim.
Pennsylvania’s comparative negligence rule then determines how fault affects recovery — you can recover as long as you were not more than 50% at fault, reduced by your share. And the value of your claim depends on your injuries, the available insurance, and your tort election, all of which shape what your car accident case is worth. The statistics set the scene; an attorney builds your individual case within it.
If you are reading this in the aftermath of a crash, the most useful thing on this page may not be a statistic at all — it is knowing the steps to take after a car accident to protect your health and your claim from the very first day.
Frequently Asked Questions
In 2025, the most recent complete year of PennDOT data, Pennsylvania had 109,541 reportable traffic crashes — an average of about 300 per day, or roughly 13 every hour. Those crashes injured 64,988 people and killed 1,047.
In 2025, 1,047 people were killed on Pennsylvania roads — the lowest total since record-keeping began in 1928, and 80 fewer than in 2024. That averages to about three deaths per day. It marked the second straight year of record or near-record lows.
Based on PennDOT’s 2025 data and the state’s population, 1 out of every 12,473 Pennsylvanians was fatally injured in a traffic crash that year. For comparison, 1 in 55 people was involved in a reportable crash and 1 in 201 was injured. Individual risk depends heavily on behavior — speed, seat belt use, impairment, and distraction all change the odds dramatically.
Driver behavior, which PennDOT identifies as the leading factor in about 83% of crashes. In 2025, intersections were the most common crash setting (41,110 crashes), followed by speeding (24,166) and distracted driving (9,419). Impaired driving contributed to 8,658 crashes, though alcohol-related crashes and deaths fell to a five-year low.
In 2025, Lancaster County recorded 5,675 reportable crashes and 38 traffic deaths; York County recorded 4,423 crashes and 26 deaths; and Chester County recorded 4,381 crashes and 35 deaths. Notably, while Lancaster and York saw deaths fall from 2024, Chester’s rose — from 24 to 35 — driven largely by an increase in motorcyclist fatalities.
Urban corridors see the most crashes — Philadelphia’s Roosevelt Boulevard (US-1) is repeatedly ranked among the most dangerous roads in the country — and just 10 of the state’s 67 counties account for about 53% of all crashes. But rural two-lane roads are disproportionately deadly relative to their volume, because of higher speeds, no median barrier, and slower emergency response. You are more likely to crash in the city, but a rural crash is more likely to be fatal.